Read the full series:
|
Ch.1 — What OMS is and how to use it with Veeam MP |
In the previous post we discussed what the Microsoft Operations Manager Suite (OMS) is and how it can be used as a powerful extension for your Operations Manager solution on-premises. We already showed you how to connect them together and how to make sure that data from your Veeam Management Pack is being streamed to the OMS solution. Today we are going to look at alerts and use OMS to create some custom queries, use custom fields and experiment with the preview of PowerBI to create stunning visualization dashboards.
We also already mentioned that alerts data is going to be automatically available in OMS after connecting the two solutions and after you have enabled the Alerts Management solution. These alerts that appear in Operations Manager will almost instantly be available in OMS.
Making those alerts visible is done by using log queries. These log queries are run at regular intervals. The solution comes with some queries out of the box, but we are going to use some of our own search queries to display specific alerts from our Management Pack. I am not going into detail on how you need to create such a custom search. You can find the information on Microsoft TechNet.
Let’s look at some sample queries.
Sample queries
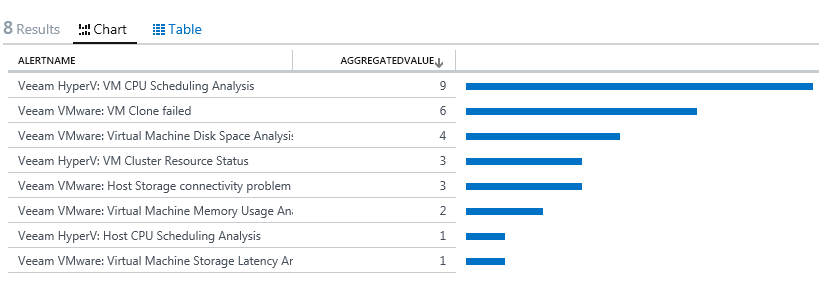
The first query we are going to use will display critical alerts coming from the Veeam Management pack in the past hour.
| Type=Alert (AlertSeverity=error or AlertSeverity=critical) TimeGenerated>NOW-24HOUR AlertState!=Closed AlertName=Veeam* | measure count() by AlertName |
The result will be the above chart displaying those alerts.
Let’s separate our search by virtualization platforms and create a query specific for Hyper-V Alerts:
| Type=Alert (AlertSeverity=error or AlertSeverity=critical) TimeGenerated>NOW-24HOUR AlertState!=Closed AlertName=Veeam*HyperV* | select SourceDisplayName, AlertName |
As you can see in the above image, we have 13 alerts on our Hyper-V platform. Now let’s continue with this query and image we have an SLA or KPI in our organization, defined for the operations team. Now you can setup an alert rule based on the number of open Hyper-V alerts. To do so, you need to add an alert rule.
Custom Fields
When you are streaming data into OMS, it is sometimes necessary to do some additional configuration to make the data work for you. For example, with the recently announced custom logs support in OMS, you will have to use custom fields to extract certain parts out of your raw data.
But besides for custom logs, these custom fields can also be very useful for Veeam Alerts.
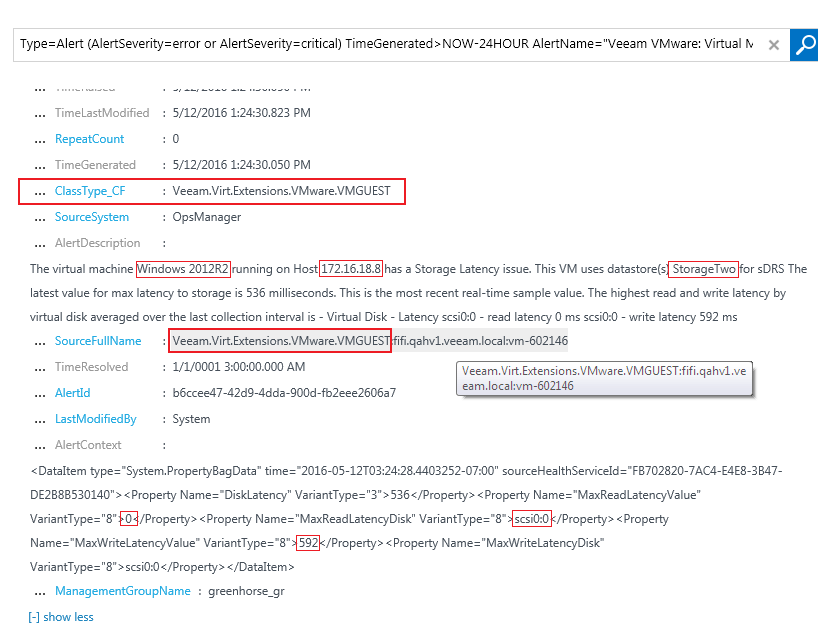
For example, you can extract the Class type from almost each Operations Manager alert, which is contained in the SourceFullName property.
Also from the above example, you can see that for certain Alerts the name of the VM, Host, Datastore and other different metric information can be extracted.
Keep in mind that each VM ID in Veeam Management Pack also contains the vCenter name, so this could also be extracted for all VM-related alerts (VMware).
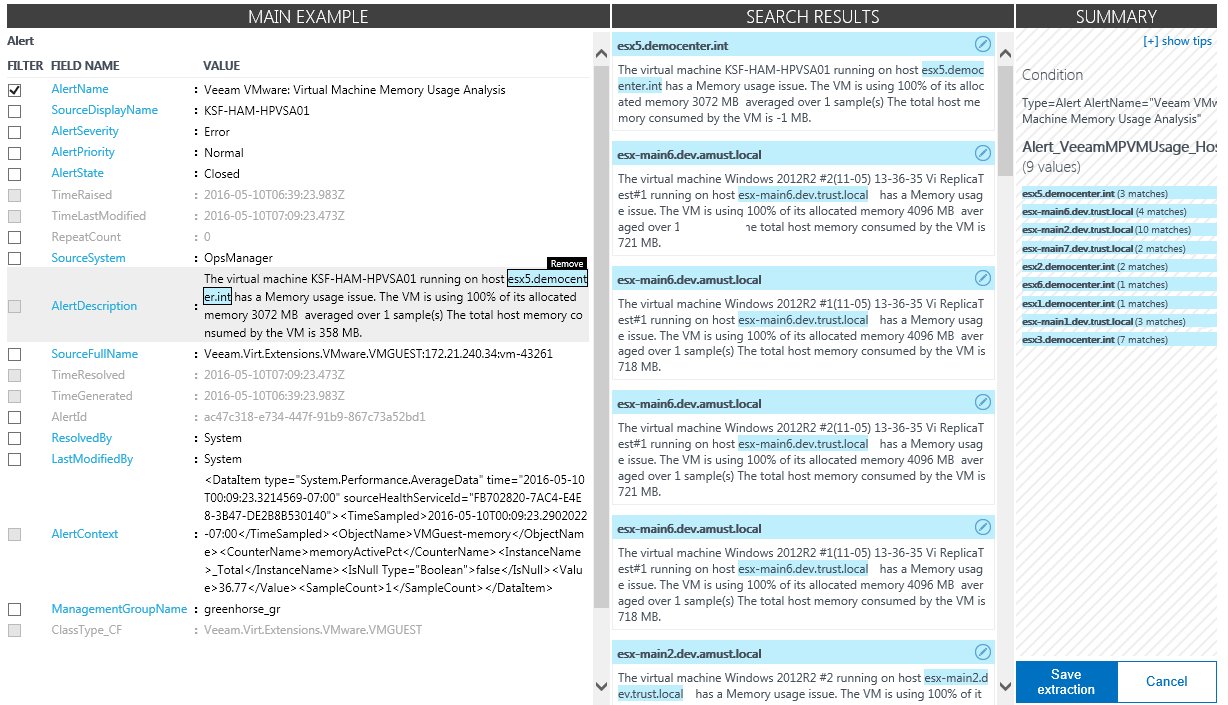
For example, let’s select to extract fields from the AlertDescription field of the “Veeam VMware: Virtual Machine memory Usage Analysis” alert.
First, run the following query:
| Type=Alert (AlertSeverity=error or AlertSeverity=critical) TimeGenerated>NOW-24HOUR AlertName=”Veeam VMware: Virtual Machine Memory Usage Analysis” |
After receiving the alerts from your query, click on the dots for the AlertDescription field and select “Extract fields from Alert”
Make sure we’ve specified that the field is relevant only for this particular Alert (click the checkbox next to the alert name) – for any other alert the text is going to be different and the custom field will not be extracted or could be extracted incorrectly which could create a mess in your OMS.
Select the host name in the Alert text, specify the name for the Custom Field and make sure the custom field is extracted correctly from all the Alert descriptions (tweak if necessary). Finally click Save.
Now we can group those Memory usage alerts by Hosts to identify the host with the most memory pressure issues.
You might even take this one step further and extract the configured RAM value, make an OMS alert and then associate an Azure automation runbook to add RAM for the affected VM.
Power BI
As already said in the first part of this series, developments for new features in OMS are done in a rapid pace and one of the more promising features (in preview as of the time of writing) is Power BI. Again, this can be very useful for the data that is collected by the Veeam Management Pack.
Note: Before you can do this, you need to enable this functionality in the Preview Features.
After that, you need to connect your PowerBI account to OMS. For more information, check out the article Integrating OMS and Power BI.
After that you should be able to configure OMS for streaming data into PowerBI. Just go to search and select all performance data Type=Alert, and then you can stream all the data or filter it (for example by reporting Management Server).
Finally, click on the PowerBI menu item and let’s create a schedule to regularly push (or stream) data and do some visualization around it.
Specify the Name for the Rule, Dataset Name and Schedule, which is going to be used to push data into PowerBI.
After that your dataset should appear under Settings > PowerBI, where you can enable/disable synchronization, delete datasets and observe the health of the dataset synchronization.
When the data is pushed to PowerBI, you can start creating useful visualization dashboards.
As an example, in the below image, you can see a dashboard that displays the overall volume of Veeam Alerts and how it’s spread across different object classes and by total volume of the specific alerts.
Conclusion
By getting your alerts data from the Veeam Management Pack into OMS, you can use search queries, use custom fields and even experiment already with the PowerBI preview functionality and bring additional value to your organization. What we showed is just one small example that can be used and depending on your needs you will be able to extract the data you need and make those rules and visualizations necessary.
In the next part, we are going to look at how we can add performance data into OMS and use that data to build charts and visualizations.


