The main idea of the previous was to provide a deep and detailed overview of Veeam ONE capabilities, with a strong focus on service providers’ infrastructure. The feedback of our community and the reports which were highlighted there dramatically simplifies service providers’ daily monitoring and activity.
Today we’ll uncover how service providers using VMware Cloud Director can build additional services based on Veeam ONE solution. And in contrast to previous blogs, we will move our attention from “what” to “how”.
Frontend
Frankly speaking, the concept of multitenancy in Veeam ONE is not widely known. There are numerous reasons why, but we’ll put them aside. What is important — if you already have Veeam ONE installed and VMware Cloud Director added as a monitored instance — is that everything is ready for providing it as a service. No additional steps are required to enable multitenancy. Let’s check the details.
Veeam ONE frontend consists of two core elements – Veeam ONE Client and Veeam ONE Web Client.
Veeam ONE Client is Windows-based .NET application that provides you real-time monitoring of the virtual and backup environment from different perspectives. However, the basic requirements of having a Windows terminal station to utilize it makes it almost impossible to add it as a service offering.
On the other hand, Veeam ONE Web Client is a web-based application which makes it a perfect solution for multi-tenant use.
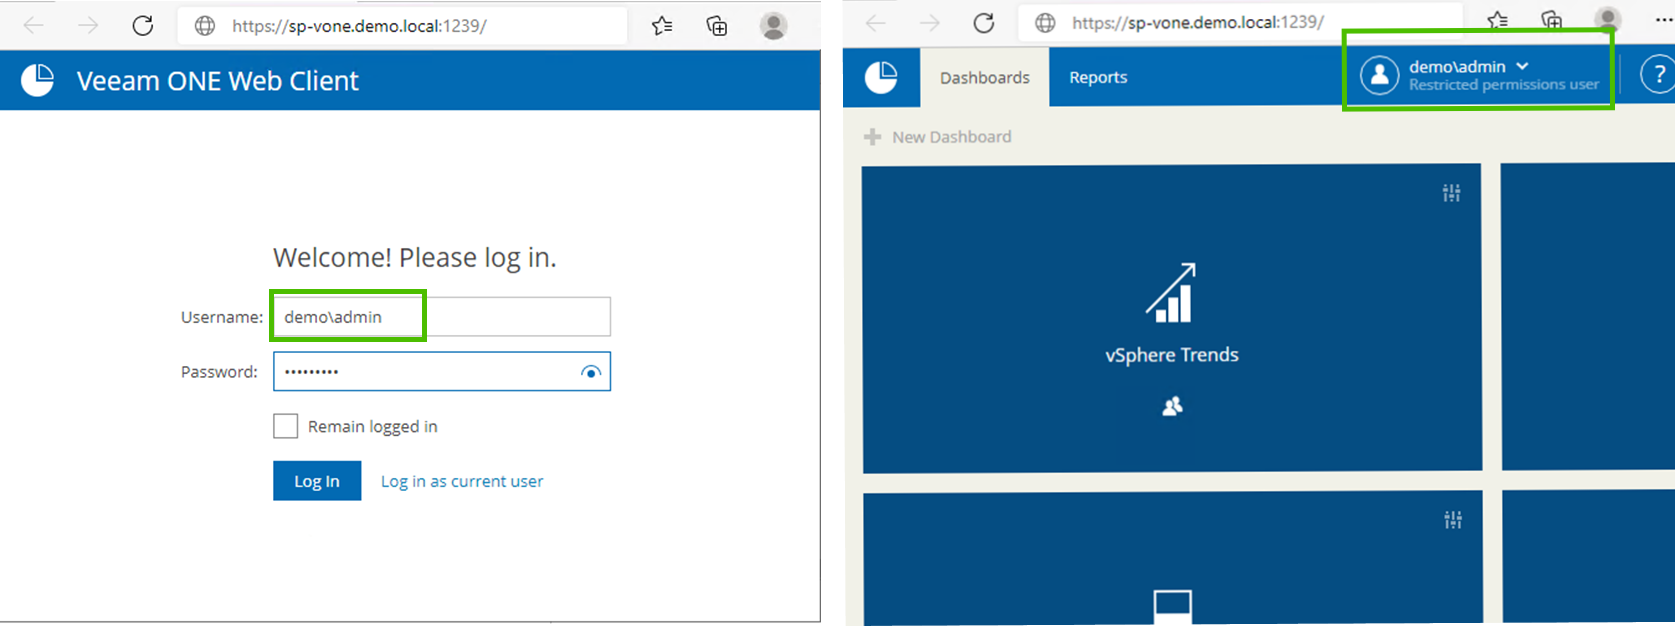
When VMware Cloud Director is added to Veeam ONE configuration, vCD organization user can log in using their native VMware Cloud Director credentials (organization\username) to Veeam ONE Reporter. Veeam ONE Reporter will verify permissions and scope the Restricted permissions view.
Such tenant will then have access to a specific set of dashboards and reports.
More configuration details can be found in the User Guide.
Dashboards
In Veeam ONE, dashboards are providing at-a-glance view of a monitored infrastructure. Each dashboard consists of widgets, which portray various aspects of the environment. For internal infrastructure, with unlimited scope, you have more then 50 various widgets that you can combine. Most valuable widgets and recommendations on combining them into dashboards will be covered in another blog. Here, we will focus on representation for a customer in IaaS infrastructure.
When the tenant logs into Web Client with VMware Cloud Director account — all shared dashboards will be presented. However, most of widgets will be unavailable, due to restrictions. These restrictions generally cause confusion and discourage the customer from using the portal.
To improve user experience, complete a few steps in advance:
1) Log in with Veeam ONE administrator credentials and turn off sharing for all default dashboards.
It will hide unnecessary dashboards for tenants with Restricted view.
2) Create new dashboards, that will be shared with customers.
We recommend creating at least two:
- [Tenant – Monitoring]
- [Tenant – Performance]
Later we will populate them with widgets. If needed, you can customize appearance of dashboards (preview image and color)
3) Enable public access to tenant dashboards.
That will make dashboard visible for tenants with Restricted view.
4) Populate Dashboards with following widgets.
[Tenant – Monitoring]
Preview:
| Widget pack | Widget | |
| vSphere Alarms | Total Issues by Day | Daily number of warnings and errors that were triggered during the week |
| vSphere Alarms | Top Issues | Most typical alarms in your environment and shows the number of times each alarm was triggered |
| vSphere Alarms | Top VMs | VMs with the highest number of registered errors and warnings |
| vSphere Datastore Space Usage | Top Growing Guest Disks | VMs with the least amount of free guest disk space |
| vSphere Datastore Space Usage | Top Active VMs with Snapshots | VMs with the largest snapshots |
| vSphere General Information | VMs Growth | Number of VMs in your virtual infrastructure |
| vSphere General Information | VM Uptime | The average uptime value for VM |
| vSphere General Information | Wasted Resources | Amount of over-provisioned resources in your environment |
[Tenant – Performance]
Preview:
| Widget Pack | Widget | |
| vSphere General Information | Top VMs by CPU | Highest average level of CPU utilization |
| vSphere General Information | Top VMs by IOPS | Highest average number of IOPS |
| vSphere General Information | Top VMs by Memory | Highest average level of memory utilization |
| vSphere General Information | Top VMs by Network I/O | Highest average network throughput values |
| vSphere General Information | Top VMs by Read Latency | Highest average Read Latency metric values |
| vSphere General Information | Top VMs by Write Latency | Average Write Latency metric values |
5) Log in to Veeam One Web Client with tenant credentials.
As a tenant you can see only shared dashboards.
For most widgets, it’s possible to generate an associated report just with a couple of clicks. At the top right corner of the widget, expand the menu and click View Full Report. Select correct scope and other parameters where applicable and run the preview.
For example, in case of Wasted Resources, the dashboard related report will provide a detailed breakdown list of possible reclaimed resources. Tenant can use it to optimize the infrastructure.
Reports
As mentioned before, reporting is another key capability of Veeam ONE multitenancy offering.
Due to the product design, all report templates are visible for any tenant. Even reports which are not applicable due to restricted scope and security concerns are presented. As there are more than 120 reports it is frequently a showstopper for a tenant. It’s just easy to get lost.
However, Veeam ONE provides and simple mechanism for sharing preconfigured reports with tenants. That gives you an option to select most valuable reports, preconfigure them and share with tenants.
To accomplish it proceed with the following steps:
1) Log in with administrator account and find required report in Report Templates tab.
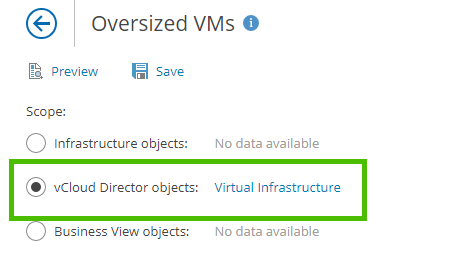
2) For scope, select VMware Cloud Director objects: Virtual Infrastructure.
Scope will be automatically adjusted to the permissions of the tenants.
Configure other setting and save report in a separate folder.
3) Share report with tenants.
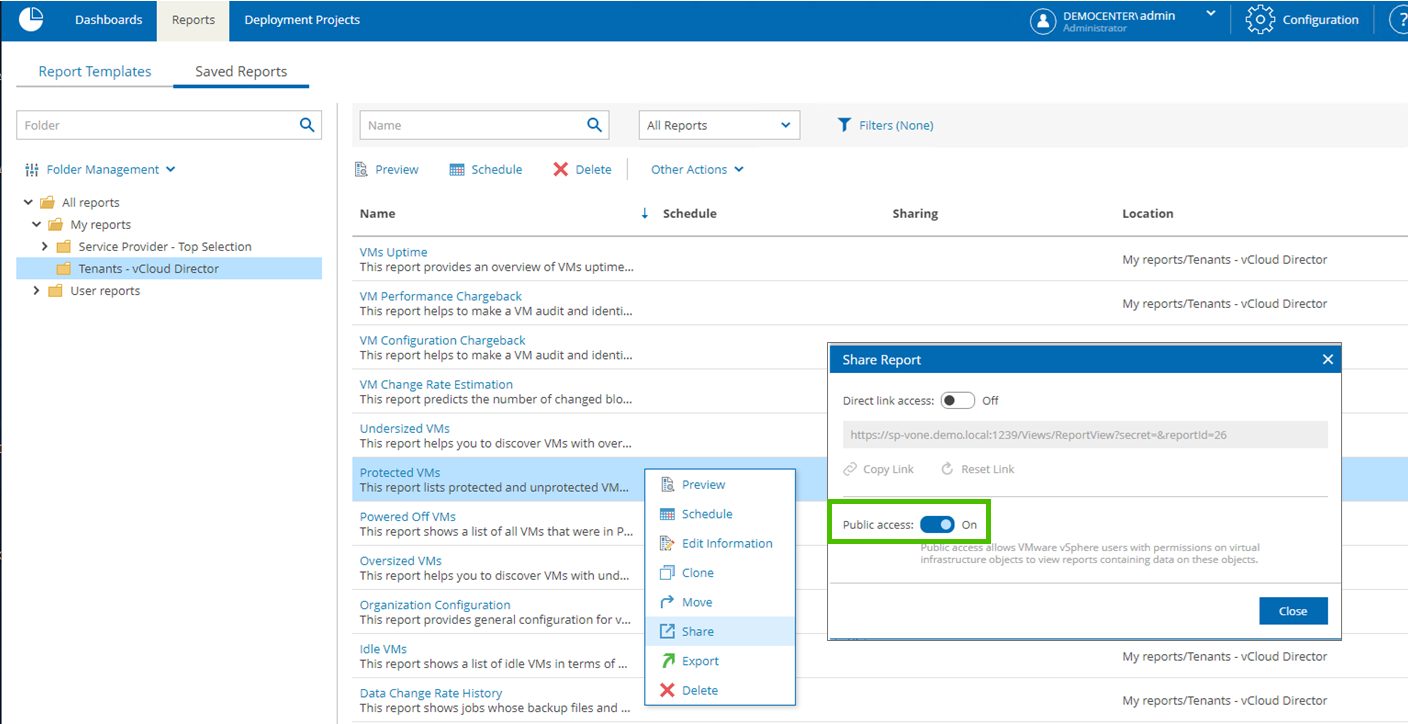
Switch to Saved Reports tab, find this report in the folder, right click and Share.
Enable public access for this report.
4) Now repeat it for all the reports you want to share with your tenants.
Now when the tenant logs in using Restricted scope, all shared reports will be visible in Reports -> Saved Reports -> All reports folder
Bonus
During last few months, we have discussed over 20 most valuable reports and shared multiple secret ways to squeeze valuable data from them.
To make this journey even more simple and straight forward we have prepared our “2021 – Top Selection of Veeam ONE reports for Service Providers” report pack to download from here.
To add it into your installation just proceed with the following:
1) Log in using administrator account
2) Switch to Reports -> Saved reports -> My reports tab
3) Right click on My reports folder and Import the downloaded JSON file
4) After import is completed, you will have a structured view of all reports that we discussed in our blogs before. Simple!
This blog is part of the series, covering Veeam ONE use cases in the service provider’s world.
Due to the complexity of the modern stack of technologies nowadays, more and more companies are migrating their workloads onto service providers IaaS platform. Usually, it requires a trade-off, as in the IaaS tenant lacks control of operations and visibility.
That makes self-service capabilities a cornerstone in any multi-tenant service offering and, by using Veeam, you can easily achieve that. And now, as it was uncovered in this article, you can enhance this service even further, by providing Veeam ONE Web Client capabilities to your tenants.
Also, make sure to check out the recording of our technical webinar, Powerful Monitoring & Analytics for Cloud & Service Providers (Thursday, Oct. 28, 11 a.m. CEST), where Artem Philippov and Yury Lichman provided a deep-dive of Veeam ONE use cases for service providers.


