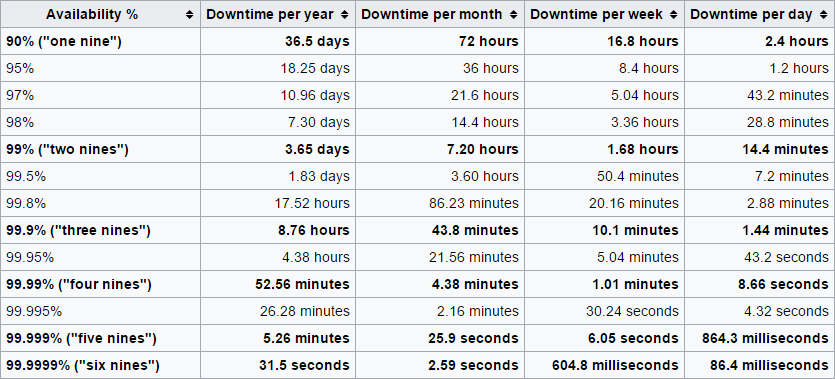
Server uptime defines high Availability, there’s no denial of that. To ensure that all the critical services are available for customers, you need to provide a near-continuous uptime of your infrastructure. Inability to do so will result in downtime that will cost you real money. To measure your Availability, a concept of “Nines” was introduced (see Fig. 1) to show the correlation between the guaranteed uptime percentage and the downtime per day/week/month/year that is allowed at the corresponding level. And of course, the more “Nines” you want, the more expensive it would get to sustain the Availability at the highest level possible. With the “five nines” (or a 99.999% Availability) being acceptable for most of the scenarios, allowing for 5.26 minutes of downtime per year, the “six nines” are getting adopted more and more, giving as little as 31.5 seconds of downtime a year!

But that’s not the only application of an uptime measurement. As it’s generally a good thing that a critical server or a service runs without interruptions, it may be a sign that it’s time for a due maintenance, for example. Or if non-critical VMs have a low uptime percentage, you can re-purpose the hardware that they’re occupying for more important needs.
How to measure server uptime?
There are plenty of options to get the uptime of the server, but they’re mostly limited to one machine. Queries through the command-line or WMI will show you things like system’s uptime or last boot up time, but they’re not always presented in the most relevant or user-friendly way. PowerShell comes in handy with all the scripts floating around the internet that will get an uptime from multiple servers, but in the end collected data would be far from a descriptive report. So how do you get a comprehensive, hassle-free and easy-to-process report with, for example, a bundle of all VMs from a host/cluster? You can use our monitoring tool Veeam ONE Free Edition to create a multitude of reports both for VMware and Hyper-V infrastructures! And in those reports are host/VM uptime ones too.
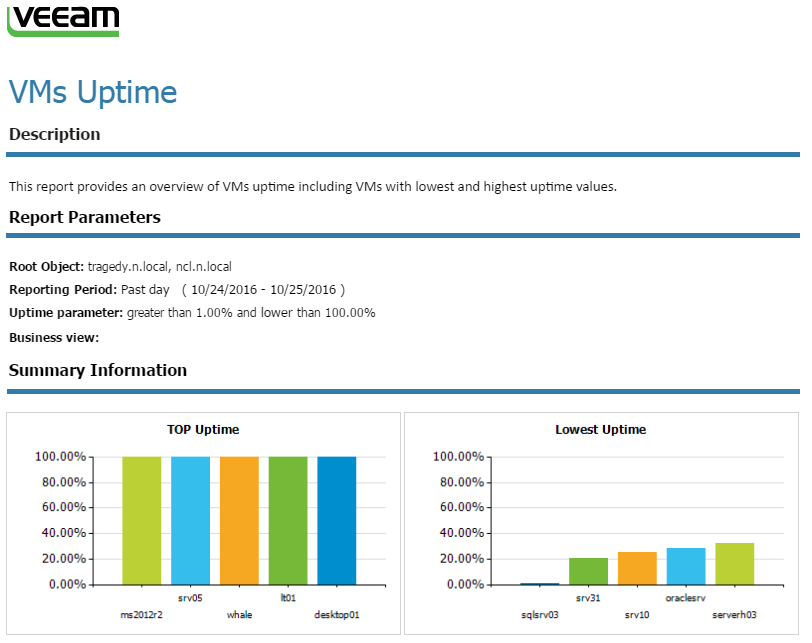
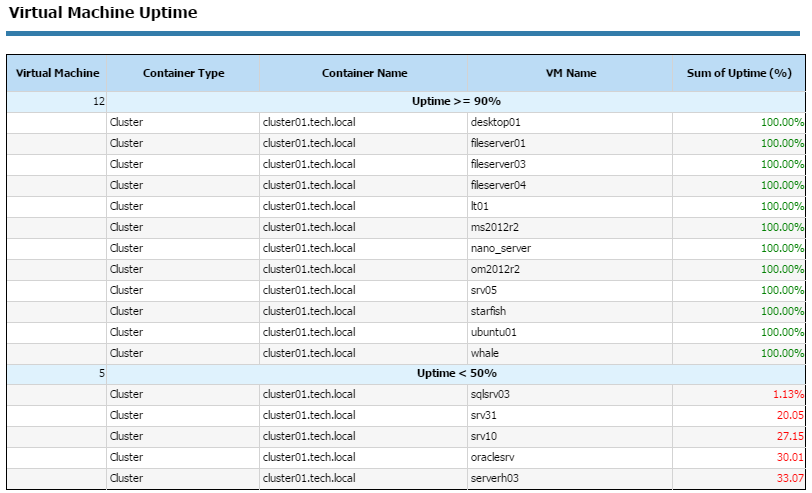
A typical VMs report looks like this:


All the information is conveniently presented on a single page and can be grouped by either a server uptime, cluster, host or datastore. Additionally, you can drill down each of the VMs for detailed information on alarms and restart events, as well as easily export the report in Excel, PDF or Word formats. Good news is, you don’t need to buy another license to open this functionality – these and many other reports are available for you in the free version of the product!
The installation process is fairly simple:
- Check the prerequisites before you begin the installation and then proceed to the detailed step-by-step guide to download and install the latest version of Veeam ONE monitor and its patches.
- Once you’ve installed the software and added your infrastructure, you are now able to generate reports. Additionally, you can change the “Group by” parameter of the report.
And that’s basically it! You can generate server uptime reports for VMs in Hyper-V environment and uptime reports for hosts and VMs in VMware infrastructure (even a “downtime” parameter will be shown). For now, there’s no host uptime reports with Hyper-V but that might be changed in the future. Enjoy the ease of monitoring and crispy clean reports that will help you to control your environment even better.
Helpful links
- Veeam ONE editions comparison
- Permissions guide to ensure proper operation of Veeam ONE
