Veeam Report Library for Microsoft System Center
- Free products
- Veeam Report Library for Microsoft System Center
Enhanced Microsoft System Center reporting
Free forever – unlimited VMs
The Veeam Report Library for Microsoft System Center includes:
-
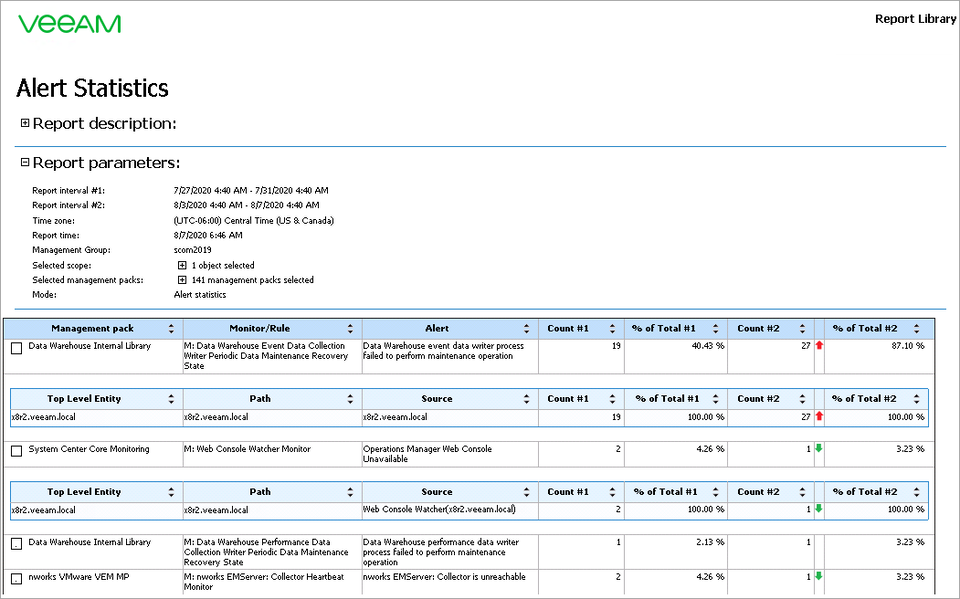
Veeam Alert Statistics Report - shows alert statistics for selected filter parameters.
This report extends Microsoft System Center reporting by adding two modes of analysis―per rule/monitor (Alert Statistics mode) and per object (Troublemakers mode)―as well as two levels of detail for every mode, a comparison of time intervals, management pack selection and interactive table
-
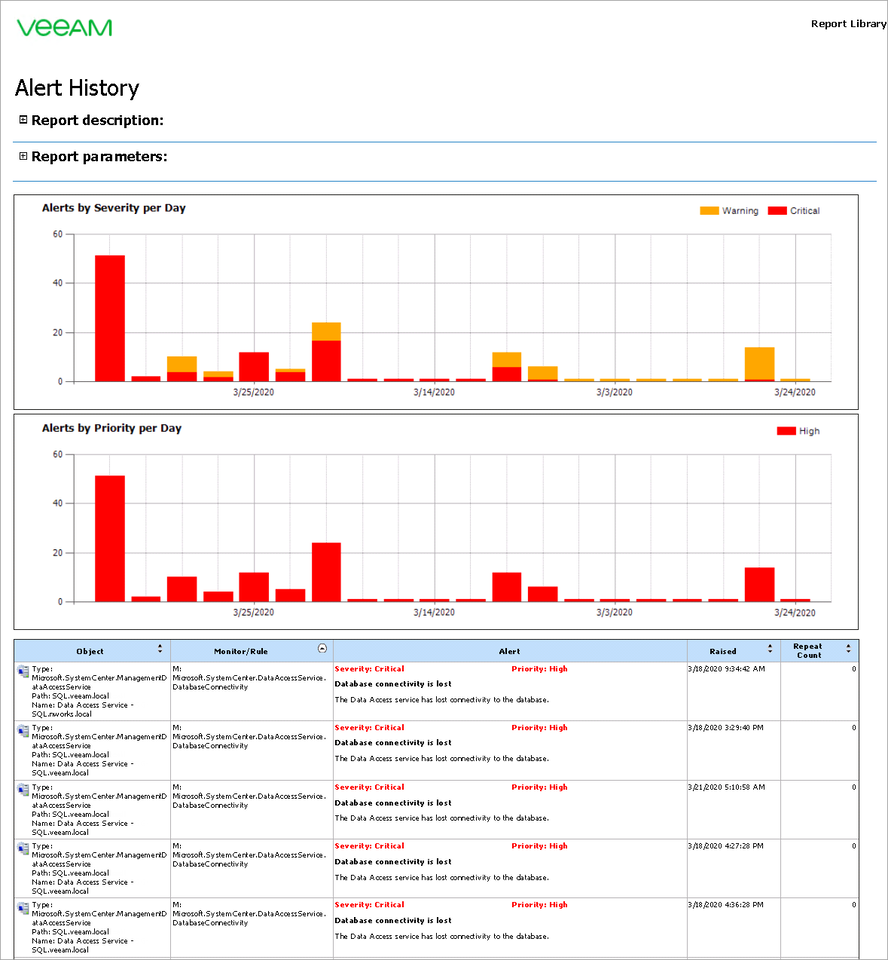
Veeam Alert History Report - shows information on alerts raised for infrastructure objects across a time range.
This report provides a detailed alerting history, helps to identify the most affected infrastructure objects. It helps you review health state for the specified time period and details how many alerts with different severity and priority levels were raised on each day of the reporting period.
-
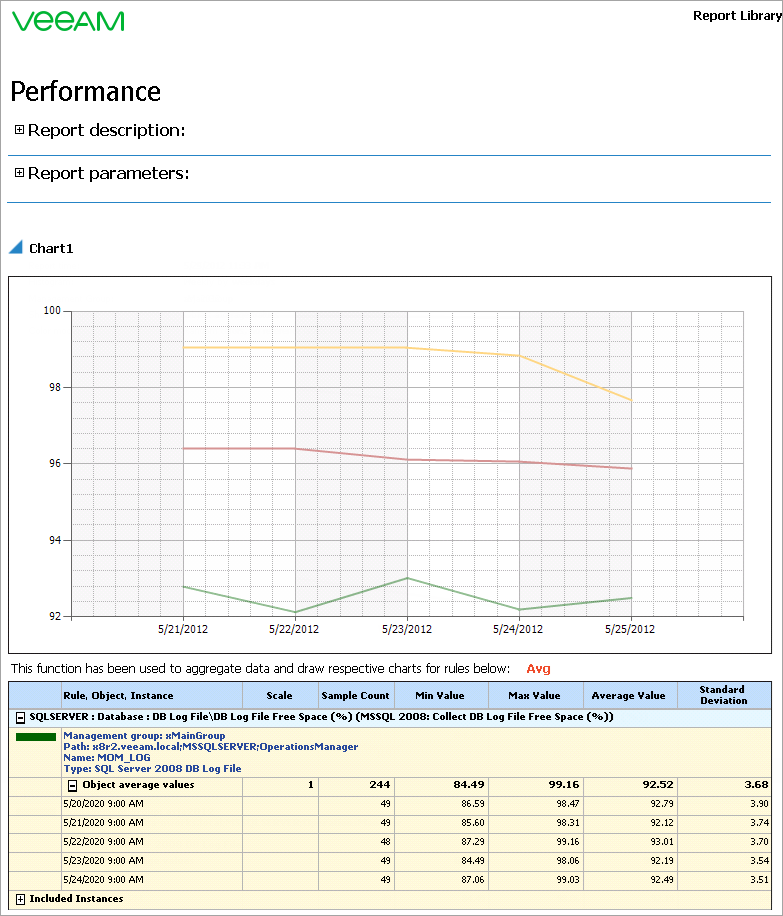
Veeam Performance Report - aggregates historical data to show performance counter values on one or more charts and tables.
This report extends the System Center reporting to include the creation of a separate series for object/instance average values, line colors and daily/hourly values for the selected period.
-
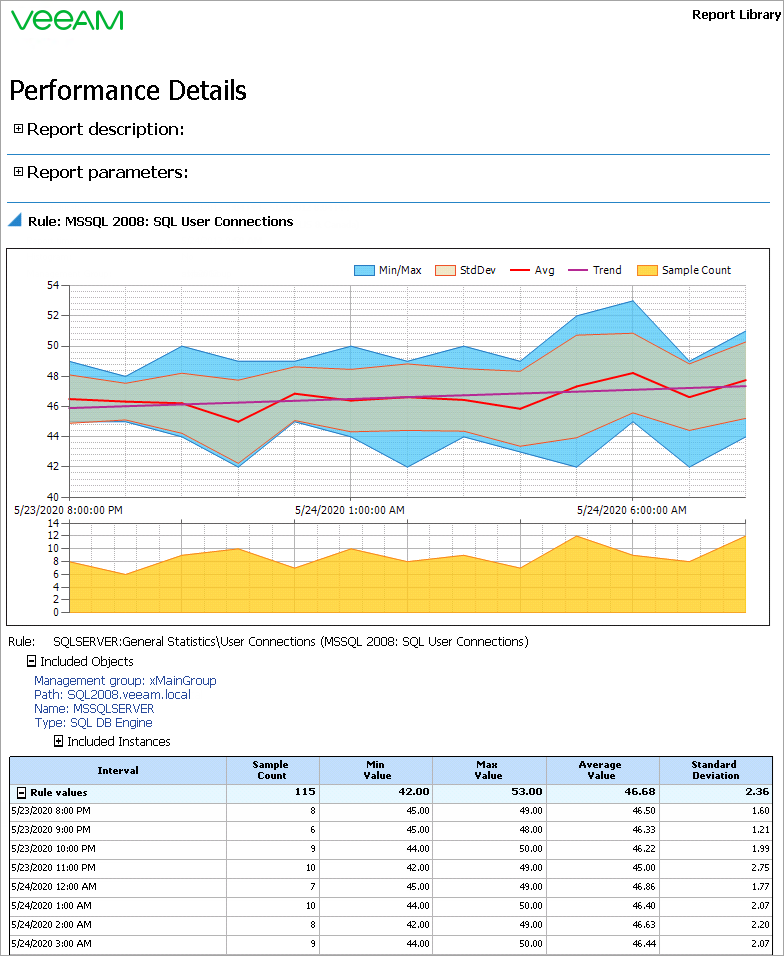
Veeam Performance Details Report - aggregates historical data to show performance counter values with drill down for data.
This report extends Microsoft System Center reporting by adding a display of a separate series of data that illustrate performance trend for the reporting period.
-
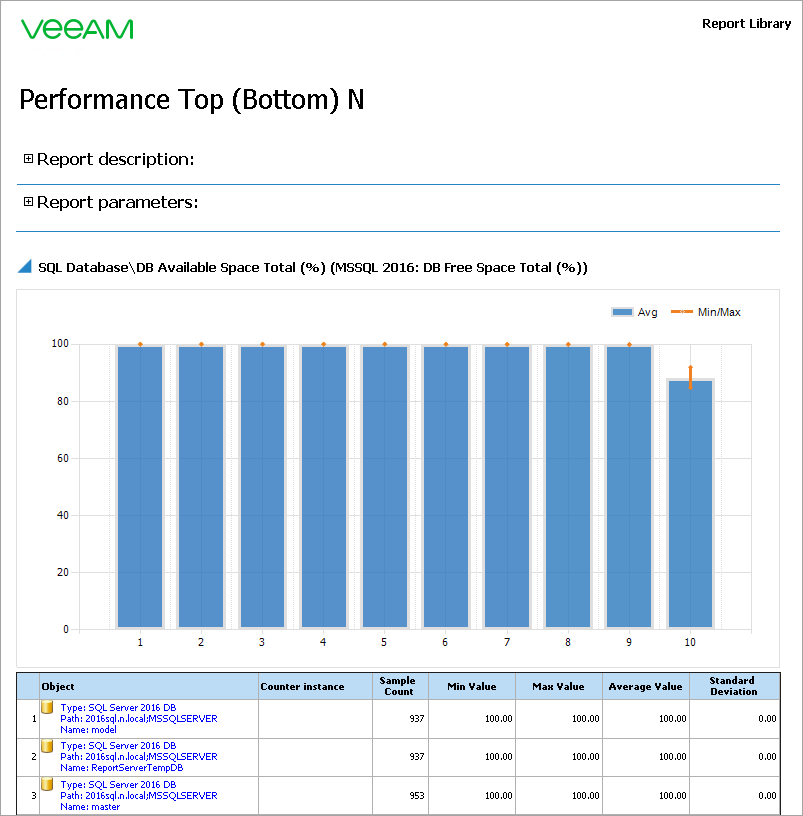
Veeam Performance Top (Bottom) N Report - aggregates historical performance data to show top or bottom N infrastructure objects, performance counters, or both, for a specific rule.
This report extends the functionality of the Microsoft Performance Top Instances and Performance Top Objects reports with enhanced grouping options, scope selection and sorting by aggregate functions with two aggregation types.
-
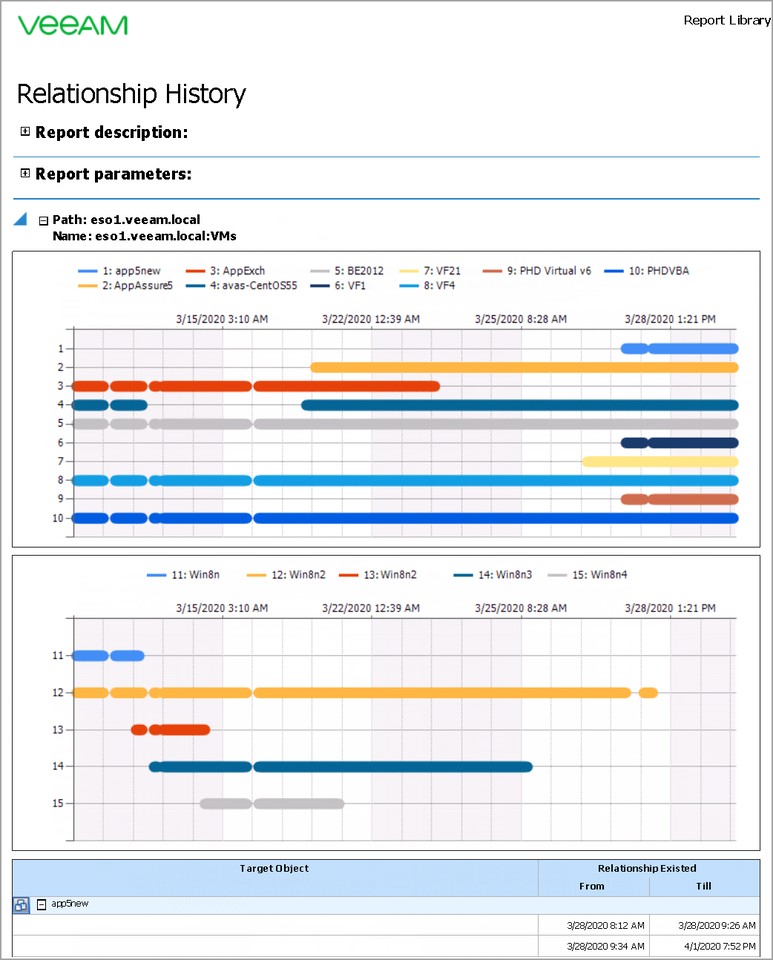
Veeam Relationship History Report - allows you to choose a specific type of relationship between infrastructure objects and track changes for this relationship over a time interval.
This report allows you to choose Source, Target (or both) as the perspective used to analyze relationship. It also allows you to group report statistics by Source or Target.
-
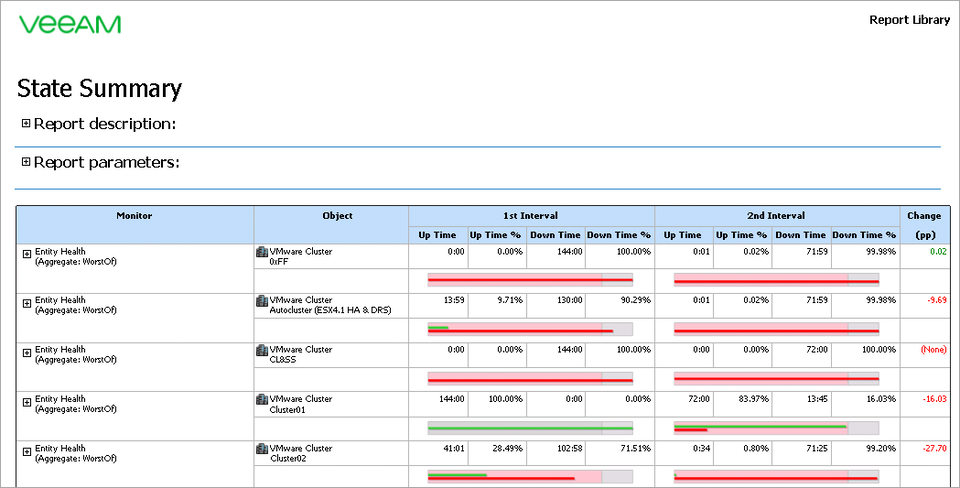
Veeam State Summary Report - shows the time in healthy/unhealthy state for selected infrastructure objects’ monitor across a time range.
This report extends System Center reporting by allowing you to compare health state of infrastructure objects within two time intervals and to choose a specific monitor to analyze the report.
Supported Platforms
- Microsoft System Center Operations Manager 2019
- Microsoft System Center Operations Manager 2016
- Microsoft System Center Operations Manager 2012 R2
Operations Manager Components
- Operations Manager Reporting components properly installed and configured
- The Veeam Report Library supports Microsoft SQL Server Reporting Services: SQL Server 2019, SQL Server 2017, SQL Server 2016, SQL Server 2014, SQL Server 2012 SP3
Download FREE Product
Oops! Something went wrong.
Please, try again later.
